كيف تعرف من شاهد بطاقتك الرقمية؟
هل تستطيع معرفة من شاهد بطاقتك الرقمية؟ تستطيع معرفة كم شخصاً شاهدها، ومتى، ومن أي مدينة، وعلى أي جهاز، وهل لمسوا بطاقة NFC أم مسحوا رمز QR. ما لا تستطيع رؤيته هو الهوية الشخصية للزائر المجهول، وهذا مقصود بالتصميم: تحليلات بطاقة العمل الرقمية من ScaanMe مجمّعة وليست مراقبة. إليك بالضبط ما تعرضه اللوحة، وما لا تعرضه عمداً، وكيف تحوّل الأرقام إلى متابعات وحجوزات.
ما تستطيع رؤيته
| المقياس | ما يخبرك به |
|---|---|
| إجمالي الزيارات | كم مرة فُتحت بطاقتك |
| الزوار الفريدون | كم شخصاً مختلفاً، مقابل الزيارات المتكررة |
| لمسات NFC مقابل مسح QR | أي طريقة مشاركة تعمل بجهد أكبر لصالحك |
| البيانات الجغرافية | في أي مدن ودول يتواجد مشاهدوك |
| تقسيم الأجهزة | iOS مقابل Android مقابل الحاسوب |
| أوقات الذروة | متى يفتح الناس بطاقتك غالباً |
| حفظ جهة الاتصال | كم شخصاً حمّل ملف vcf الخاص بك |
| نقرات الروابط | أي الروابط تحصد أكبر تفاعل |
| حفظ بطاقة المحفظة | كم شخصاً أبقى بطاقتك في محفظة Apple أو Google، صافية بعد الإزالات |
ما لا تراه، عن قصد
لا اسم ولا رقم هاتف ولا بريد لأي مشاهد يُلتقط إلا إذا اختار هو مشاركته، مثلاً بتعبئة نموذج التواصل أو حجز موعد. وهذا الخط مهم قانونياً وأخلاقياً معاً: التحليلات المجمّعة تبقيك بعيداً عن التزامات الموافقة التي يفرضها تتبع الهوية بموجب GDPR وقوانين البيانات الإقليمية المشروحة في دليل خصوصية البطاقة الرقمية. والقاعدة المجمّعة نفسها تنطبق على كل قناة: لمسة NFC أو مسح QR يسجلان القناة واللحظة، ولا يسجلان أبداً الشخص الذي خلفهما.
التحليلات الجيدة تجيب عن سؤال "هل تواصلي المهني يعمل؟" دون أن تسأل أبداً "من كان ذلك الشخص بالضبط؟"
كيف تتصرف بناء على الأرقام
بعد فعالية تواصل
افحص اللوحة في الصباح التالي. خمسون مصافحة وثماني عشرة زيارة للبطاقة تعني تحويلاً بنسبة 36% من اللقاء إلى الاتصال الرقمي، وهذه النسبة تخبرك كم كان اهتمام القاعة حاراً لتعرف مقدار الجهد الذي تبذله في متابعة جهات الاتصال التي جمعتها في الأسبوع نفسه، والأرقام تخبرك بحجم هذه المهمة قبل أن تبدأها.
لفرق المبيعات
قارن الزيارات والحفظ والنقرات بين أعضاء الفريق. من يشارك بفعالية أكبر؟ وأي المعارض تولّد تفاعلاً حقيقياً بدل مسرحية مسح الشارات؟ حرّك الميزانية وفق ذلك، واحكم على الاتجاهات الشهرية لا على فعالية واحدة: مؤتمر واحد ضجيج، وربع سنة كامل نمط واضح.
لتحسين المحتوى
إذا كان رابط أعمالك يحصد ثلاثة أضعاف نقرات رابط الحجز، فتخطيط البطاقة يخبرك بما يريده الزوار أولاً. أبرز زر الحجز أو أعد ترتيب الأقسام، ثم راقب هل تتغير النسبة.
للاستهداف الجغرافي
تجمّع المشاهدين في مدينة لا تزورها إشارة سوق. المسوق في عمّان الذي يرى زيارات ثابتة من إربد لديه سبب لجدولة يوم هناك؛ والاستشاري الذي يشاهده زوار من الخليج يستطيع مواءمة اللغات وساعات العمل معهم، بل وتخصيص حملات إعلانية صغيرة للمدن التي تظهر باستمرار في لوحته.
لاختيار NFC أم QR
إذا كانت اللمسات تسحق المسحات فواصل الاستثمار في مشاركة NFC؛ وإذا كانت ملصقات QR المطبوعة تجلب معظم الزيارات فاطبع المزيد منها. التقسيم يحسم الجدل بالبيانات. ومع 5.56 مليار شخص متصل بالإنترنت وفق تقرير DataReportal الرقمي 2025، كل من تقابله تقريباً يستطيع فتح البطاقة؛ والتحليلات تخبرك من أي باب دخل.
للولاء والاحتفاظ
حفظ بطاقات المحفظة أوضح إشارة احتفاظ لديك. حين يبقي أحدهم بطاقة محفظة Apple أو Google لديه، فهو اختار أن يسمع منك مجدداً، وعدد الحفظ الصافي، الحفظ ناقص الإزالة، يخبرك كم هذا الجمهور وفيّ. أرسل لهؤلاء بثّاً للمالكين عند وجود جديد، وراقب هل يرتفع الحفظ بعد كل حملة.
ماذا تشمل كل خطة
| الخطة | التحليلات |
|---|---|
| الخطة المجانية | إجمالي الزيارات وإحصاءات أساسية |
| الخطط المدفوعة، من 8 دولارات شهرياً | تحليلات كاملة: الجغرافيا والأجهزة وأوقات الذروة ونقرات الروابط ومقارنة الفريق في المستويات الأعلى |
التفاصيل والمستويات الحالية في صفحة الأسعار.
الأسئلة الشائعة
هل أقدر أشوف بالضبط مين فتح بطاقتي؟
لا، ولا منصة صادقة تستطيع ذلك. أنت ترى الأعداد والمدن والأجهزة والأوقات، لا الهويات. الزائر يصبح معروفاً لك فقط عندما يختار الفعل: حفظ جهة اتصالك أو تعبئة نموذجك أو حجز اجتماع.
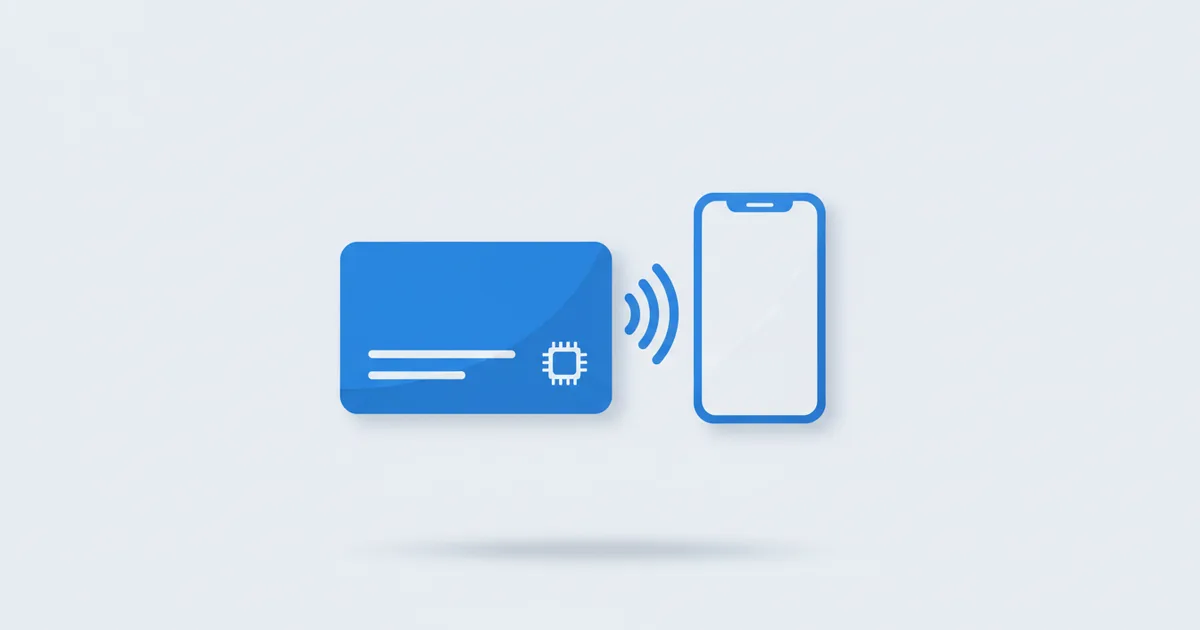
وش الفرق بين لمسات NFC ومسح QR في الإحصاءات؟
اللمسة تعني أن شخصاً لامس بطاقتك المادية بهاتفه؛ والمسح يعني أنه وجّه الكاميرا نحو رمز QR المطبوع أو المعروض. تتبعهما منفصلين يريك أي قناة مشاركة تستحق ثمنها.
هل يصلني إشعار عندما يحفظ أحدهم جهة اتصالي؟
حفظ جهات الاتصال يظهر في إحصاءات لوحتك، فتراقب العداد يرتفع بعد الفعاليات. أما الإشعارات فتصل مع الأفعال التي تتضمن بيانات الزائر نفسه، مثل النماذج والحجوزات.
لماذا تقفز زياراتي بينما يبقى الحفظ ثابتاً؟
غالباً مشكلة محتوى لا مشكلة زيارات. الزوار يفتحون البطاقة ويغادرون دون فعل، فاشدد العنوان، وقدّم زري واتساب والحفظ إلى الأعلى، وافحص جدول نقرات الروابط لتعرف ما يلمسه الناس فعلاً.